Equipment-toy car
-video camera -sign with cm marked on it -pole (to lean sign on) -Windows Live Movie Maker -Microsoft Excel |
Procedure First, we set up the sign against the pole and put the camera where we could see all of the cm markings. Then we filmed the car as it drove accross the table. We uploaded the video to Windows Live Movie Maker and found 9 data points for the position of the car versus time. Then I made a graph on Microsoft Excel and used the program to make a best-fit line. I then found the derivative of this equation to find the velocity equation.
|
Data
|
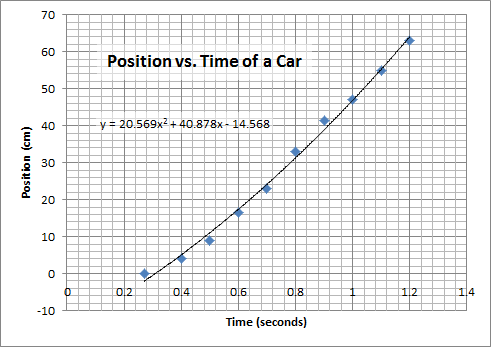
Conclusion
The purpose of this lab was to observe motion through video and collect data points in order to find a best-fit line and to derive a velocity equation. The data points collected may not be exactly right because it was difficult to measure exactly where the car was in the video. Because of this, the best-fit equation and the velocity equation might not be exactly correct.
