Purpose1. Develop the sinusoidal equations of motion for a pendulum.
2. Compare the experimental period to the calculated period. |
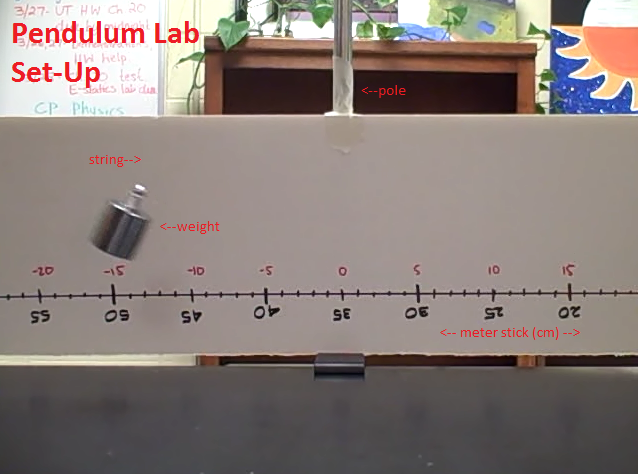
Equipment-Pole (to attach to table and hang pendulum from)
-Weight -String -Meter Stick -Video Camera -Logger Pro Software -Excel Software |
Procedure
1. Set up pendulum and equipment to measure distance from center.
2. Start recording at an adequate distance away to still see the weight and meter stick clearly.
3. Release weight from a height an appropriate distance away and record video for at least 4 complete cycles.
4. Analyze video using Logger Pro and Excel and get time versus distance from center data.
5. Calculate the period
Data
|
The length of the pendulum is 0.38 m.
|
Below is an Excel document with the data points from the experiment.
|
||
Data Analysis
Below is a word document with how the experimental and theoretical periods were calculated and the percent error between them.
| pendulum_lab_data_analysis.docx |
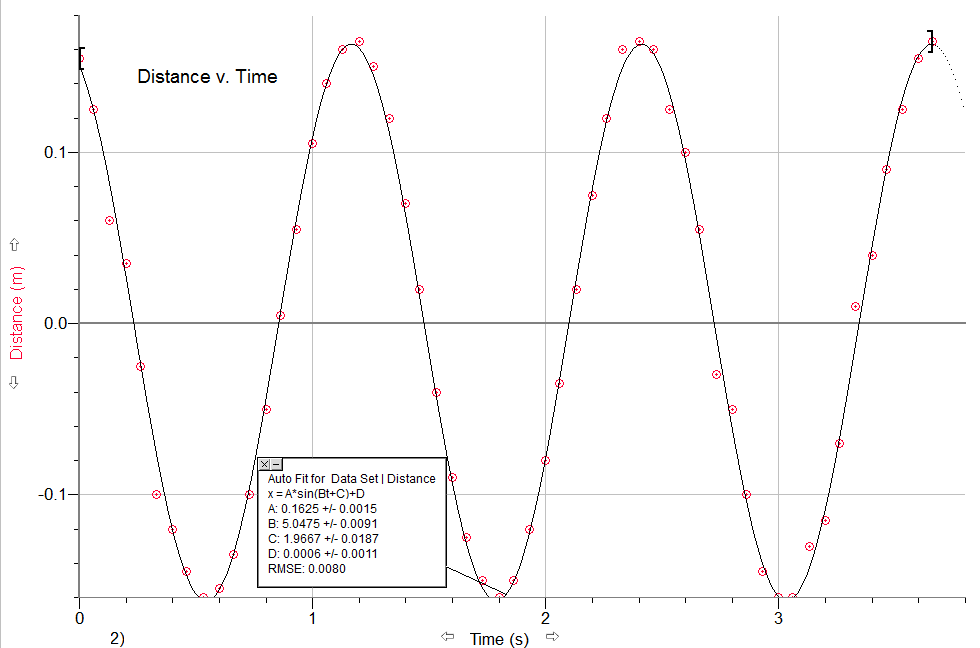
Conclusion
The purpose of this lab was to develop an equation for the motion of the pendulum and calculate the period experimentally and theoretically. The equation for the motion of the pendulum was x(t) = 0.1625 sin(5.0475t + 1.9667) +0.0006. The experimental period was 1.2448 seconds and the theoretical period was 1.2366 seconds. The percent error between them is 0.66%. My error is probably because I manually recorded the data points from what I saw in the video. My distances that I recorded were not extremely accurate because of my human error. Overall, my percent error was very small and my period made sense.
